


애플 기업분석(영문)
 등록일 / 수정일
- 페이지 / 형식
- 자료평가
- 구매가격
- 2011.03.15 / 2019.12.24
- 14페이지 /
 docx (MS워드 2007이상)
 - 평가한 분이 없습니다. (구매금액의 3%지급)
- 1,400원
최대 20페이지까지 미리보기 서비스를 제공합니다.
자료평가하면 구매금액의 3%지급!
 1
1 2
2 3
3 4
4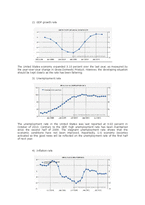 5
5 6
6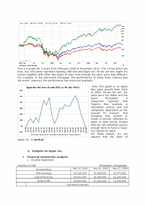 7
7 8
8 9
9 10
10 11
11 12
12 13
13 14
14
추천 연관자료
- 목차
-
Introduction
1. Analysis on economy
Global economy
National wide economy
2. Analysis on the personal computer
Industry
Personal computers industry
analysis
Is the stock of Apple Inc.
Defensive or Cyclical?
3. Analysis on Apple Inc.
Financial statements analysis
Various ratios analysis
Conclusion
- 본문내용
-
2. Analysis on the personal computer industry
Personal computers industry analysis
Description 1-Day Price Chg % Market Cap P/E ROE % Div. Yield % Debt to
Equity Price to
Book Net Profit
Margin Price To Free Cash Flow
Technology 1.489 10689.09B 17.378 14.095 0.789 128.152 36.976 8.006 77.959
Personal Computers 1.428 291.65B 19.7 26.8 0 85.311 6.04 11.4 20.9
Apple Inc. 1.18 267.05B 22.004 35.47 0 NA 6.194 20.72 85.807
The table above shows the operating efficiency of this industry and Apple inc. the ratios such as P/E, ROE, etc. indicate that Apple made remarkable sales operation, compared the industry. For example, ROE measures how much a firm makes profit in a year. Apple’s ROE is around 8% point higher than that of the personal computers industry. Since stocks in this industry as well as Apple’s are sensitive to the economy, they seem to reflect that the economy will improve soon.
Is the stock of Apple Inc. Defensive or Cyclical?
What is the type of the stock of Apple Inc.? We acquired some hints from these graphs.
This is a graph for 3 years from February 2008 to November 2010. The 3 lines which are blue, red, and green represent Nasdaq, S&P 500 and Apple Inc. As we can see, Apple Inc moved together with other two types of index even though the stock price was different. For example, in the sub-prime mortgage, the performance of these three indexes was the worst. However, the performance has improved gradually.
Also, this graph is on Apple Mac sales growth from 2003 to 2009. As we can see, the sales were not stable and the figure fluctuated. A researcher reported that “Apple’s Mac busi¬ness is some¬what cycli¬cal and not com¬pletely depen¬dent on the broader PC mar¬ket.” And releasing new version or model is directly reflected on sales. In other words, models that are not refreshed quickly enough tend to have a neg¬a¬tive impact on sales.
For these reason, we can assume that the stock of Apple Inc. is cyclical.
3. Analysis on Apple Inc.
Financial statements analysis
1. Income statement
.
Currency in USD All numbers in thousands
Period Ending Sep 25, 2010 Sep 26, 2009 Sep 27, 2008
Total Revenue 65,225,000 42,905,000 32,479,000
Cost of Revenue 39,541,000 25,683,000 21,334,000
Gross Profit 25,684,000 17,222,000 11,145,000
Operating Expenses
Research Development 1,782,000 1,333,000 1,109,000
Selling General and Administrative 5,517,000 4,149,000 3,761,000
Total Operating Expenses 7,299,000 5,482,000 4,870,000
Operating Income or Loss 18,385,000 11,740,000 6,275,000
Income from Continuing Operations
Total Other Income/Expenses Net 155,000 326,000 620,000
Earnings Before Interest And Taxes 18,540,000 12,066,000 6,895,000
Interest Expense - - -
Income Before Tax 18,540,000 12,066,000 6,895,000
Income Tax Expense 4,527,000 3,831,000 2,061,000
Net Income 14,013,000 8,235,000 4,834,000
Preferred Stock And Other Adjustments - - -
Net Income Applicable To Common Shares $14,013,000 $8,235,000 $4,834,000
In 2010 Apple’s total revenue grew by $23billion, and its net income is almost twice as much as that in 2009.
2. Balance sheet
Currency in USD. All numbers in thousands
Period Ending Sep 25, 2010 Sep 26, 2009 Sep 27, 2008
Assets
Current Assets
Cash And Cash Equivalents 11,261,000 5,263,000 11,875,000
Short Term Investments 14,359,000 18,201,000 12,615,000
Net Receivables 11,560,000 6,192,000 6,151,000
자료평가
-
아직 평가한 내용이 없습니다.
오늘 본 자료
더보기
최근 판매 자료
- [호텔경영] 하얏트(Hyatt) 호텔의 SNS마케팅 분석
- 기업의 일반환경 중 경제적 환경에 대해 설명하고, 현재 기업이 처해있는 경제적 환경(이자율, 유가, 환율, 물가 등)에 대해 사례와 함께 설명하시오
- 넷플릭스 한국시장 진출전략 사례분석 - 넷플릭스 기업분석과 국내 문화산업에 미친영향 분석 및 넷플릭스 한국시장 현지화전략과 마케팅 4P전략 분석 및 향후시사점
- 캐릭터의 정의와 특징 및 현황과 전망
- [국제통상론] 한국-EU간 주세 酒稅 분쟁사건 의미와 향후 전망
- 소비자심리학 레포트
- (경영학]헤어의 역사와 헤어펌의 종류 및 커트의 종류 분석조사)
- [경제학이론] 부당한 공동행위(카르텔)
- 중국 비즈니스 연구 - 이마트의 중국 진출 실패 - 1 5C 시장 환경 분석 2 VMS 설정 3 STP 전략 수립 4 SWOT 전략 수립 5 5P 전술 운용
- 포터의 경쟁세력모형 이론에 대해 설명하고, 관심 산업분야에서 새로운 정보기술에 의한 산업변화를 경쟁세력모형을 이용하여 설명하시오.

저작권 관련 사항 정보 및 게시물 내용의 진실성에 대하여 레포트샵은 보증하지 아니하며, 해당 정보 및 게시물의 저작권과 기타 법적 책임은 자료 등록자에게 있습니다. 위 정보 및 게시물 내용의 불법적 이용, 무단 전재·배포는 금지됩니다. 저작권침해, 명예훼손 등 분쟁요소 발견시 고객센터에 신고해 주시기 바랍니다.


